Menu


- Solutions
- Videos
- Industries
- Software
- Support
- Careers
- Company
- Contact
The Monte Carlo Method uses simulated random elements to produce expected results with the given specifications.
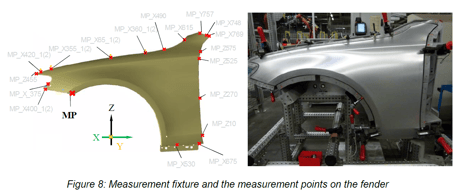
The results are given based on simulated measurements of the parts. The figure on the right shows the simulated part with highlighted measurement points compared to the actual part being measured. This gives an easy-to-understand output and allows the user to determine where they are interested in studying, focusing the model on specific areas.
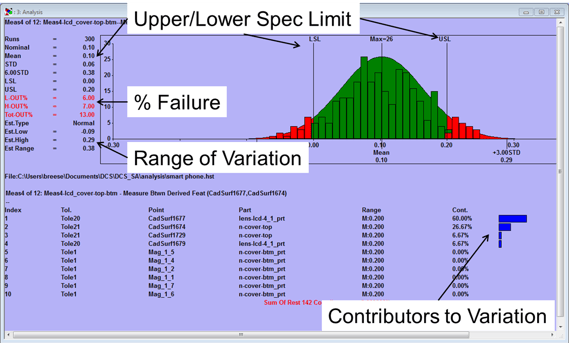
The results offer a variety of statistical metrics, as well as analysis. On the right, you can see that the percent expected to fail gives an understanding of the risk involved if the current product goes to market. In this case, there is a 13% chance of failure for each assembly. Understanding this initial risk gives engineers the ability to then optimize the build and measurement strategy to balance out the risk and cost factors in order to ensure their product meets quality standards while also controlling manufacturing costs.
The listed contributors at the bottom of the analysis show each Move, that is, assembly step and/or tolerance that is contributing to the variation in the measure. By changing these contributors, and then quickly rerunning the analysis, engineers can iteratively reduce the risk.
Alternatively, by using the Digital Twin model to drive measurement plans. engineers can utilize inspection to catch products that fail to meet specifications before they leave the plant. These products can then be pulled and either scrapped or reworked to meet specifications. If the risk is very low, it may be more cost-effective to simply catch the few outlier parts that fail inspection than to adjust the design for worst case. In order to have 100% pass on a product, the samples that only occur once every million parts would have to be accounted for, requiring more expensive processes and even additional fabrication steps like grinding in order to meet the exacting tolerances.
Worst Case Tolerance Analysis is a traditional method of performing a stack up calculation. It derives from setting all of the tolerances at their limits in order to make a measurement the largest or smallest possible by design.
This process doesn't use statistical probability and instead focuses on whether or not the product falls within its specification limits.
Therefore, the Worst Case Model is intended to predict the maximum expected variation of a given measurement. The goal is to design to this maximum to guarantee that 100 percent of the parts manufactured will assemble and function properly.
Click to Learn More and Watch the Webinar on Worst Case for When It Doesn't Make Sense
North American Innovation Center
28064 Center Oaks Ct A, Wixom, MI 48393
Call us: +1 (248) 504 6200