- Solutions
- Videos
- Industries
- Software
- Support
- Careers
- Company
- Contact
Why is tolerance analysis important to manufacturers
Tolerance analysis is the name given to a number of processes used to determine the overall variation and effect of variation on products stemming from imperfections in manufactured parts.
As part of the tolerance analysis process, both original sources of the
When manufactured, parts are never made to perfect specifications. Due to variation caused by material characteristics and manufacturing processes, such as stamping and machining, parts are always made larger or smaller than their nominal design. This variation is captured in design as tolerances, depicting the range of variation acceptable in the design.
Tolerancing is the process of determining acceptable upper and lower limits on part dimensions. These dimensions are generally a +/-, which designates how much larger or smaller a given dimension, such as an edge, profile or hole size, can be and still assemble and function properly when incorporated into the larger product. Standardized languages have been created to make it easier to understand tolerancing methods and notes from customers,
These standard languages include standards like ISO and ASME Y14.5 2009 Standard for the design language of geometric dimensioning and tolerancing (GD&T). This standard establishes a uniform practice for stating and interpreting GD&T and related requirements for use on engineering drawings and documents.
GD&T is an important part in determining part tolerances and quality. As stated by ASME,
“GD&T is an essential tool for communicating design intent — that parts from technical drawings have the desired form, fit, function and interchangeability. By providing uniformity in drawing specifications and interpretation, GD&T reduces guesswork throughout the manufacturing process — improving quality, lowering costs, and shortening deliveries.”
Tolerancing directly influences the cost and performance of a product. A piece of sheet metal that is quickly stamped using a stamping die is much cheaper to produce than one that needs to be machined to more precise dimensions. The same applies for plastics, composites and any given part. The tighter, as in the smaller, the tolerance, the more difficult the part is to produce, and the more expensive the part is. In the same regard, the performance of a part and product is influenced by tolerances. An automobile door will not close well if the tolerances are very large, and may have additional road noise from a poor seal. Aircraft wings may need large amounts of shims if the tolerances are incorrect in order to fit properly to the fuselage. This costs time, money and increases the weight of the aircraft, reducing its fuel efficiency.
Therefore, tolerancing and tolerance analysis are integral parts of the engineering process and product lifecycle management in order to produce high-quality products at reasonable prices.
There are many methods of tolerance analysis that range from the most simple as stack-ups scribbled on napkins, to advanced 3D CAD based dimensional models. There isn’t a right and wrong way, as long as your math is correct!
The real truth is, how accurate do you want your results?
As the complexity of the tolerance analysis
As mentioned above, tolerance analysis can be used to reduce product cost while improving product quality. More specifically though, why should you do tolerance analysis?
A simple answer is that the tolerances in each part manufacturing process and assembly process are statistical variables. By describing product variation as a statistical distribution, as statistical variables, variation can be addressed to reduce the possibility of
Statistical simulation tools can provide answers for questions such as:
What probability does the product have of meeting the requirements?
What percentage of assemblies will meet the requirements?
These questions are more critical in the design stage than manufacturing stage for a product. A good Dimensional Engineering simulation tool, such as 3DCS, should be able to consider designed part tolerances (e.g. the profile tolerance in part manufacturing) AND manufacturing process tolerances (e.g. the tolerance from moving a
In the manufacturing stage, the statistical reporting tools, such as QDM, can be used in controlling manufacturing quality by monitoring the process statistics. By using QDM with the simulation results from 3DCS, an engineer can also statistically compare the manufacturing results with designed results, i.e. simulation results. This method is used in Root-Cause Analysis to find quality-related problems in the manufacturing process.
Click Here to request a free custom tailored demonstration by a DCS Engineer
Many traditional methods of tolerance analysis are quick and inaccurate
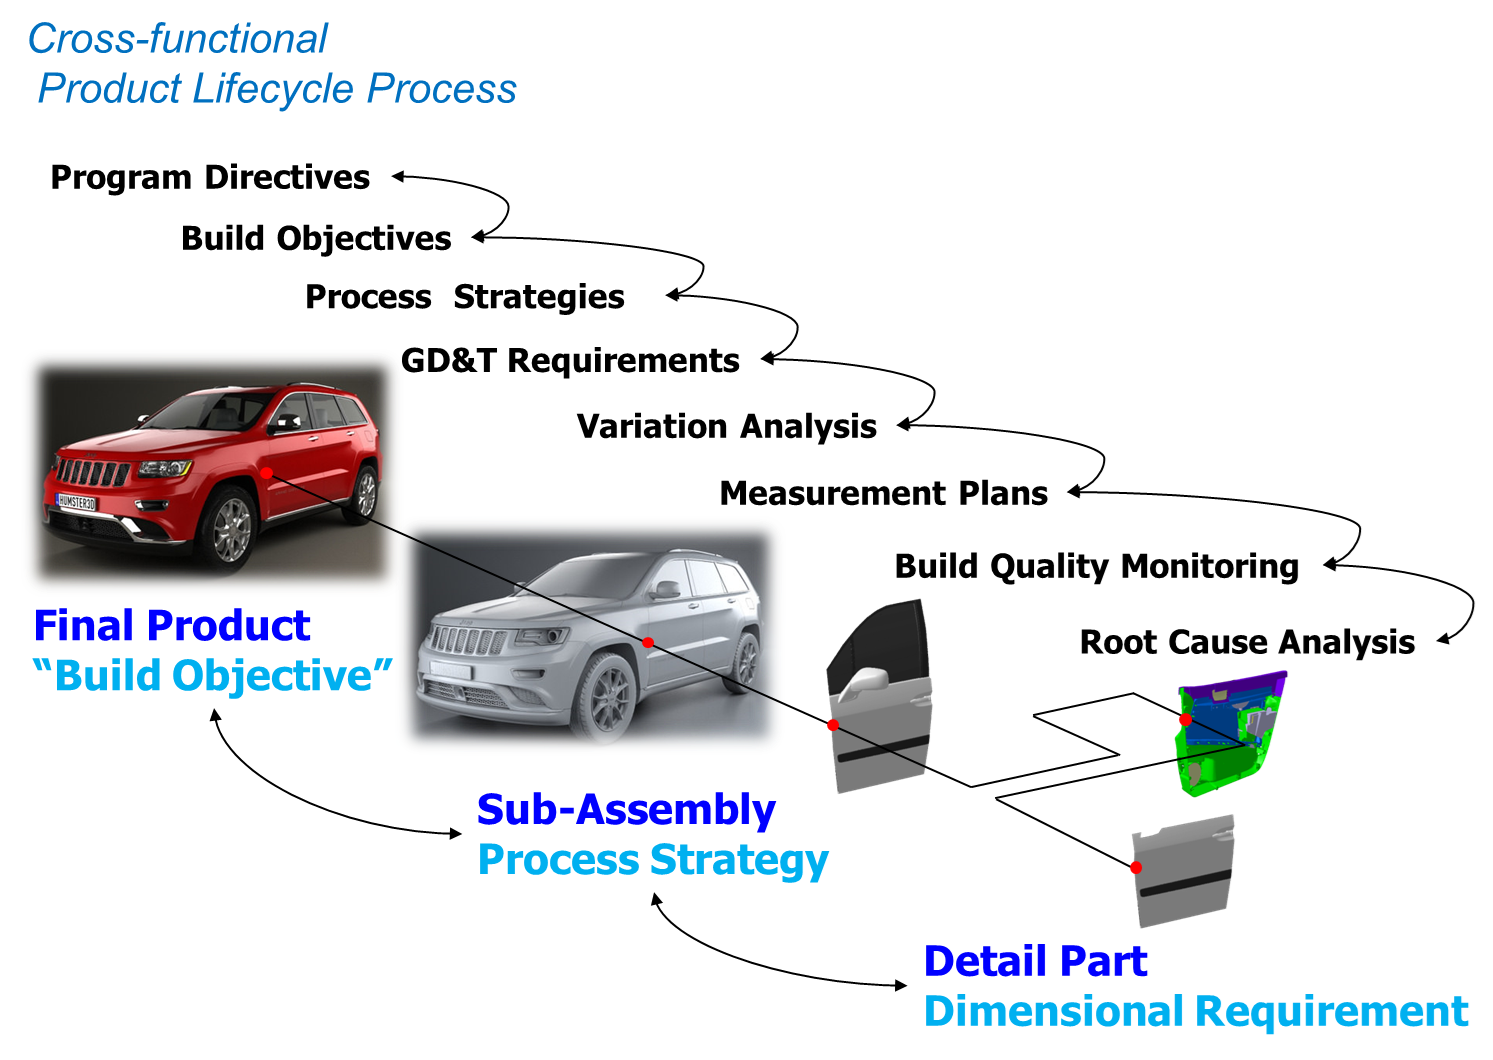
Tolerance analysis is an integral part of the engineering process
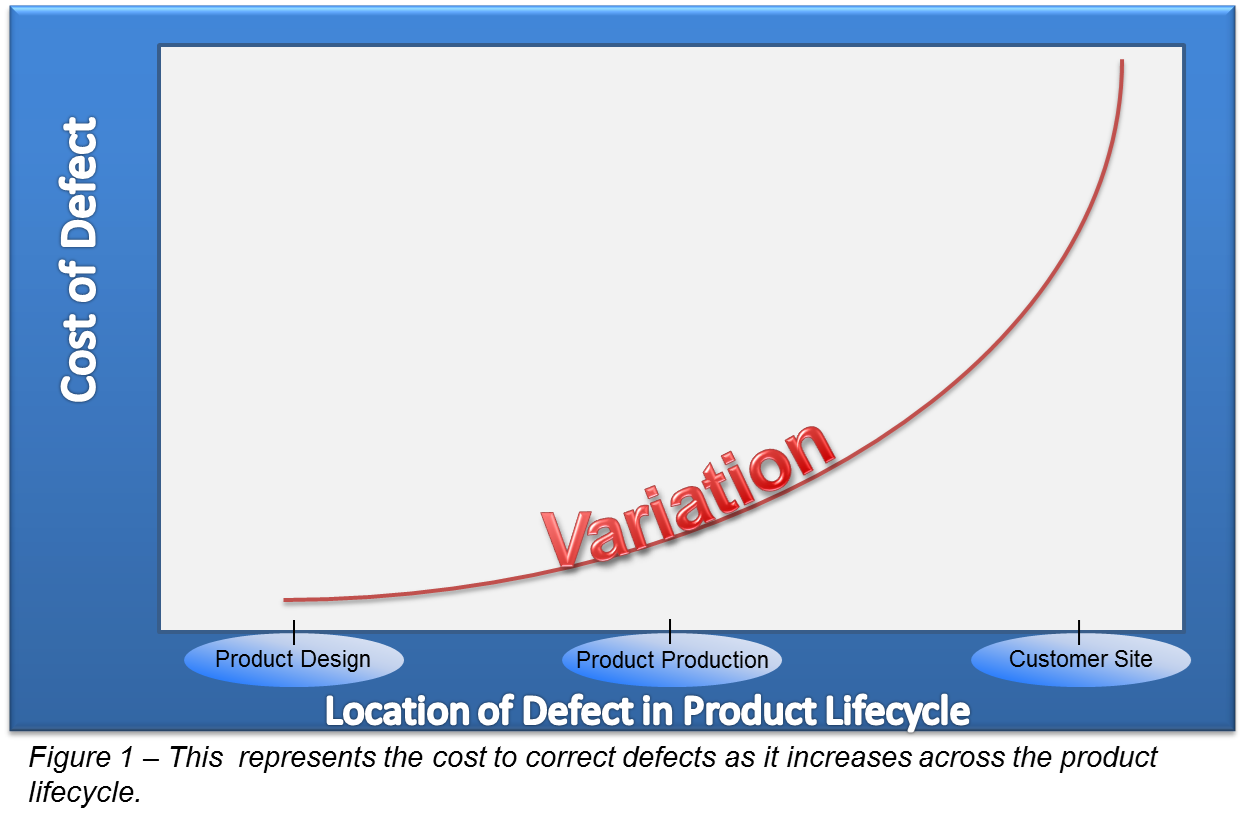
Tolerance analysis seeks to make design changes as early as possible in the product lifecycle, where they are the least expensive.
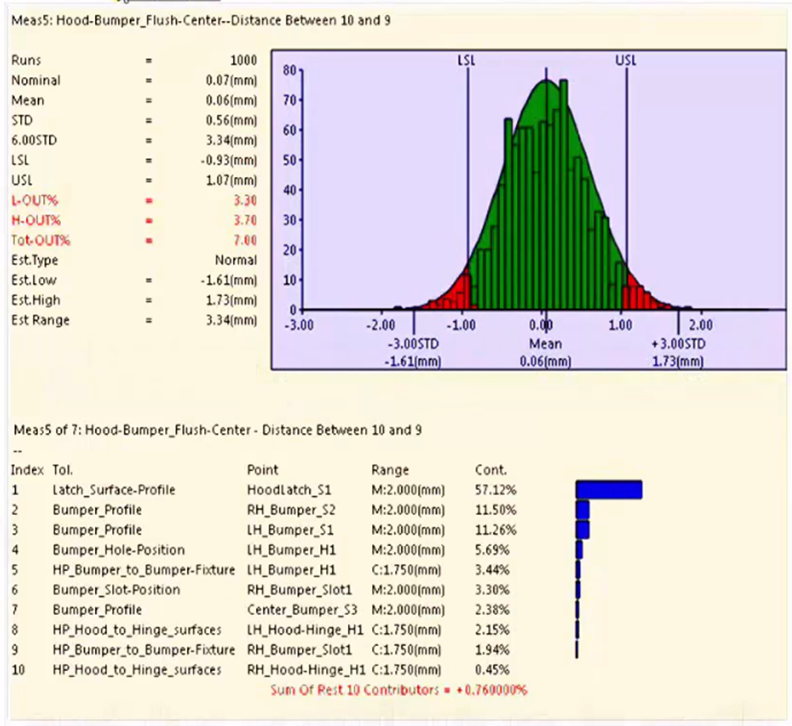
3D Tolerance Analysis gives the greatest accuracy and also allows for root cause analysis

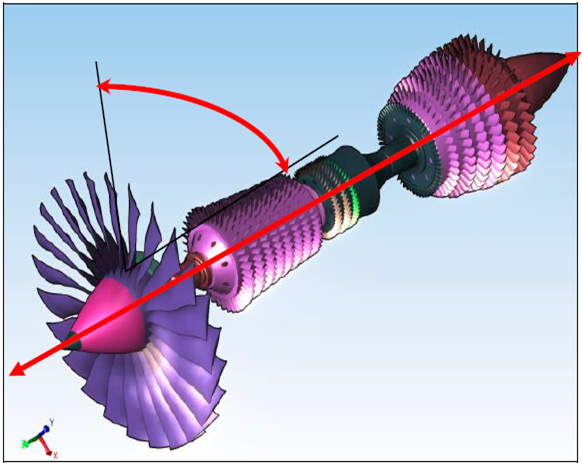
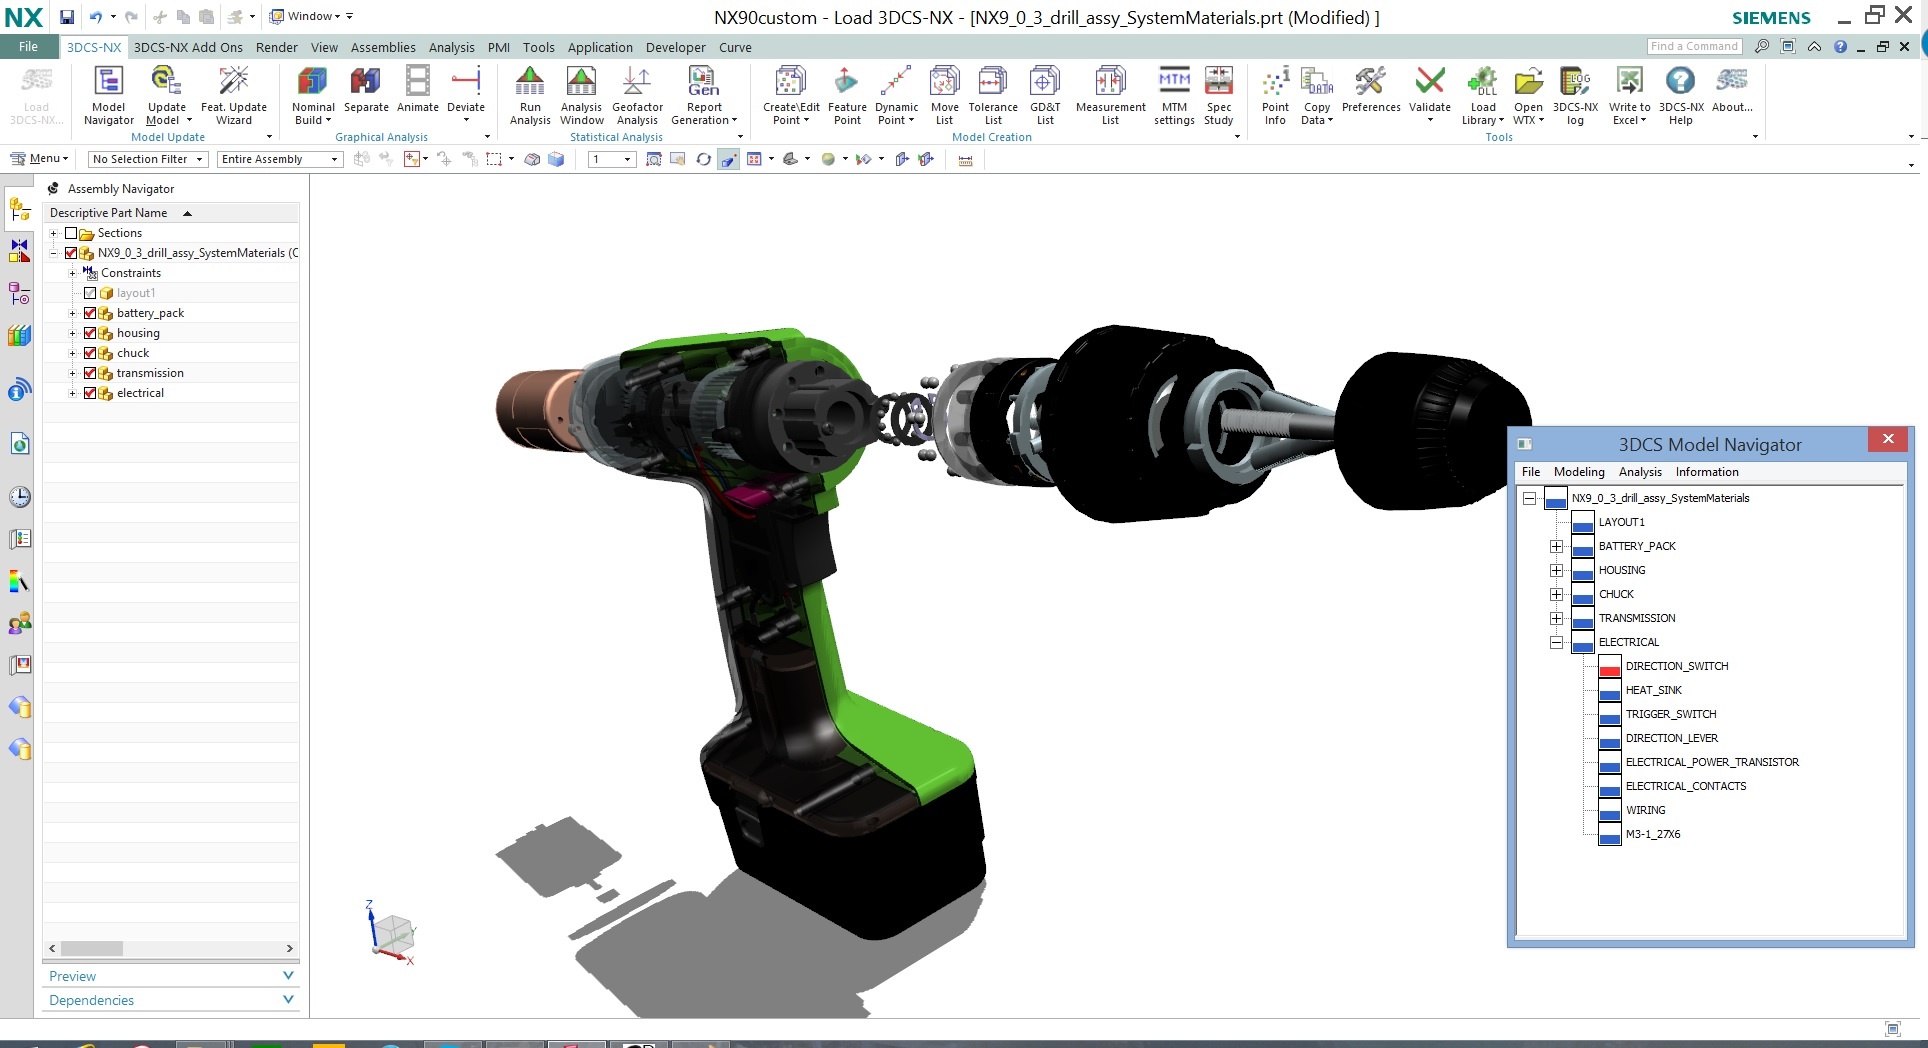
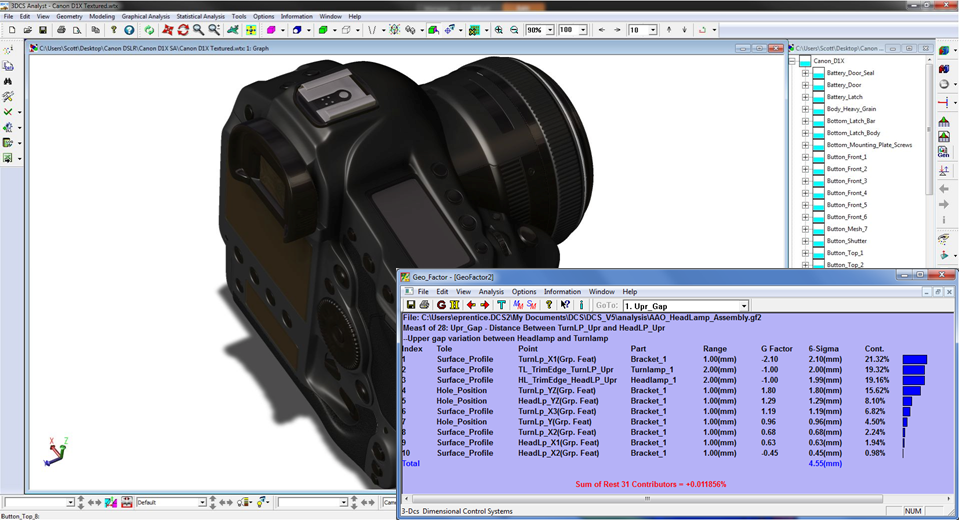

Tolerance Analysis is applied in a variety of industries: Automotive, Aerospace, Electronics, Heavy Machinery, Medical Device and more.
DCS Global Headquarters
2805 Bellingham Dr
Troy, Michigan, 48083
Phone: 1.248.269.9777
Fax: 1.248.269.9770
Website: www.3dcs.com
Email: sales@3dcs.com