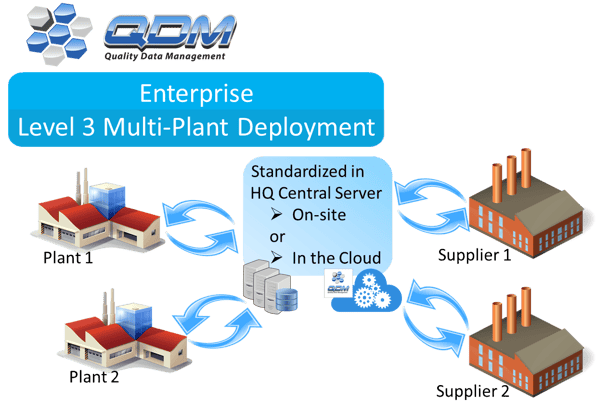
QDM WEB connects plants and suppliers to your central server, either on-site or in the cloud, and delivers actionable information for quality decision-making.
Many large enterprise organizations deal with similar problems with quality - lack of visibility, plants using different formats and hardware vendors, too much delay in getting data, and too much data. Find out how a QDM Platform provides a solution to these issues.
Automate inspection data collection across your organization
QDM WEB can monitor all of your inspection locations in multiple plants pulling and processing inspection data into your central database. As part of the data processing, QDM can be set to send automated alerts based on specified criteria. The data flow and validation of information can be managed and monitored from one interface, making setup and system management simple. External supplier interfaces can also be configured to connect suppliers directly to the system, allowing one or two-way communication and data sharing.

Use templates that incorporate CAD models to effectively communicate quality and issues, as well as dimensional and attribute information.
OEMs need customizable reports for each of their teams. Quality engineers need access to different information and need to see the same information, differently than supervisors or plant managers. QDM Templates make it easy to quickly create multiple reports from the same data set customized for the user base. These templates provide dimensional information with configurable SPC reporting formats and allow users to set alerts based on any part of the template, customized for each product.

Roll up individual component reports to higher levels for summary dashboards; part-level to sub-system to program-level to plant-level statistics and metrics.
The system automatically rolls up quality metrics based on the inspection data received and processed, updating visual dashboards in real-time. Users can intuitively drill down using the dashboard from the company level to an individual part level based on any selected SPC metric.

QDM Systems monitor production for critical metrics and trends then send alerts and messages to the user community.
QDM Alerts can be set up as a watch list, generating messages to subscribed users. These alerts and lists are configurable-able to individual user preferences, letting specific users determine what they want to watch for and which products to monitor. The system then monitors incoming data in real-time utilizing custom triggers set to watch for trends towards specification limits or any specified statistic to alert users before parts are manufactured out-of-specification.

Automatically generate and publish SPC reports to the user community.
The QDM system generates reports regularly, making them available to users with one-click access. This makes information readily available as needed, and can greatly enhance the efficiency of quality teams and users. Additional custom reports can be set to auto-generate at any specified time setting to be available for users. Users can pull these reports regardless of location, gaining access via smartphone, laptop, tablet, or workstation.

Use a structured mapping of the entire global organization’s quality data to drill down to specific data in one easy-to-navigate web-based interface.
The data drill down can be mapped to provide a quick and intuitive method of finding any specific data set. This method also provides a global overview of quality metrics. All users of this system have access to it through configurable profile preferences for local language and accessibility. Administrators can open access, or close it, to each user individually to help users access only the information they need. Users have the option to customize their interface as well for email alerts, data formats, and other personalized settings.

QDM solves many common issues facing manufacturers today
Your data is secure behind your firewall or on the cloud protected by top-of-the-line security.
Stay hardware agnostic so your plants can use any vendor.
Get all your data in standardized formats so it is easy to understand and use for decision-making.
Configure QDM to fit your organization, not the other way around.
Stay up-to-date with dashboards and alerts that constantly refresh.
Connect your supply chain to your QDM SPC Platform to both let them check their quality, and to check the quality of supplier parts before they ship.
Log in from any secure web browser on any device - phone, desktop, laptop, tablet.
Use a combination of automated reports, custom reports, dashboards, and alerts to know everything going on in your organization and create a single source for quality information.

North American Innovation Center
28064 Center Oaks Ct A, Wixom, MI 48393
Call us: +1 (248) 504 6200