 Worst Case Tolerance Analysis is a traditional method of performing a stack up calculation. It derives from setting all of the tolerances at their limits in order to make a measurement the largest or smallest possible by design.
This process doesn't use statistical probability and instead focuses on whether or not the product falls within its specification limits.
Therefore, the Worst Case Model is intended to predict the maximum expected variation of a given measurement. The goal is to design to this maximum to guarantee that 100 percent of the parts manufactured will assemble and function properly.
However, in reality, this is rarely the final outcome.
Designing to Worst Case can require extremely tight tolerances that may require expensive manufacturing and inspection processes to produce. This can drive up the cost of the parts, and increase scrap rates.
In most cases, a statistical analysis can deliver the necessary, and reliable, results needed to design to specification while lower costs by focusing on key areas to quality. That's a bold claim, though, so how do we back it up?
A 1D stack-up generally uses a single instance for Worst Case. Most utilize the maximum tolerance, the uppermost limit, when calculating the tolerance stack. This 1D Worst Case is the very largest possible outcome for the given measurement, whether it is a gap or flush or profile condition. This scenario has two important issues:
This is the largest gap, but isn't the Worst Case, meaning, it isn't the scenario with the highest product failures. It may be the case that one tolerance at it's minimum, while the others are at the maximums, could cause a tilt or geometric change to the part that may be worse for pass/fail criteria than if the gap is simply at its largest possible size.
True Worst Case considers a range of possible combinations to determine the tolerance scenario that causes the greatest number of non-conformance, or percent out of specification. This is the scenario that will be the worst possible case, rather than a mathematical sum of tolerances.
The chance that all parts are manufactured to their extremes (maximum tolerance range), and then all of those parts are chosen for the same assembly is extremely small. Like 1 in 10 million small. This has a lot to do with the assumption of standard distribution, whereby most of the manufactured parts are going to fall within the range of tolerances around the median. This makes the scenario where all tolerances are at their maximum, together, an outlier on the longtail of a six sigma graph. Modeling your product and manufacturing on an outlier is going to increase your manufacturing costs exponentially, and only to account for a scenario that will statistically never happen.
A Worst Case tolerance analysis is the only way to guarantee that good detail parts will not be out of specification. The normal assumption (RSS) carries some “risk” that bad assemblies will be made from good parts. As mentioned above, because the probability is so low of actually occurring, the Risk is frequently managed via trend adjustments. If the trend can be perceived at a point where adjustment can be made, then additional Risk can be accepted and a process modeled for 100% success rate is not needed. Instead inspection and adjustment can be used as a less expensive option to tightening tolerances.
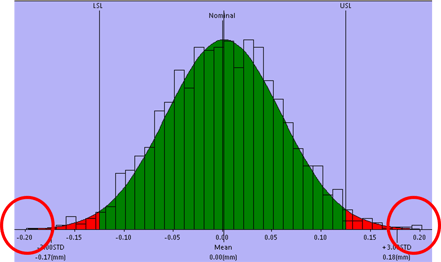
Please don't model your process based on these two scenarios!
What's more, with proper inspection, even rudimentary inspection, an outlier of that magnitude should be found during the manufacturing process and corrected, keeping it from ever leaving the plant.
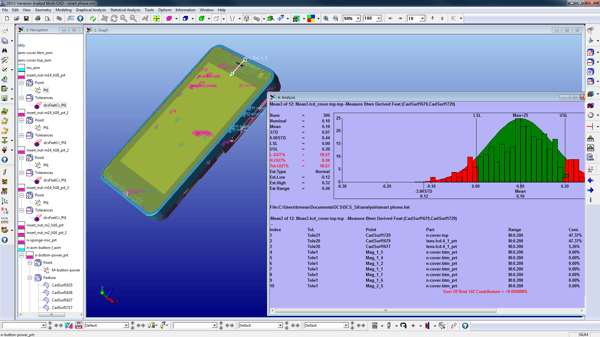
Statistical Tolerance Analysis, most often using a Monte Carlo Method, uses statistical probability to determine the percent chance parts will be out of given specification limits. It does so by randomly generating tolerance values within the given range for each tolerance in the model. It does so for hundreds and thousands of models, and then computes the statistical results of all of those random model builds together. Using the Monte Carlo Method, the default analysis isn't a true random distribution, but instead a standardized distribution that results in more tolerances being near the mean (unless a different distribution is selected!).
An alternative method uses an RSS three-dimensional stack-up analysis to determine the overall variation. This method (referred to as GeoFactor in 3DCS), is less reliable than a Monte Carlo Method for all cases, but provides additional insight into your model.
With a statistical method, there are a number of value-add's:
1. Design to a given quality level, not just 100%
2. Loosen non-critical tolerances (and thereby reduce manufacturing costs)
3. Find critical to quality tolerances for focus and measurement planning
4. Test design scenarios and solutions digitally (fewer prototypes)

North American Innovation Center
28064 Center Oaks Ct A, Wixom, MI 48393
Call us: +1 (248) 504 6200