View your scan data in complete 3D without installing any software. Simply click a button in QDMWEB QI to launch QDM QualityScan to begin.
Value:


QDM ScanWEB browser-based application provides access from any point through the secured company network. The software generates an interactive 3D deviation color plot for each individual inspection set. QDM ScanWEB allows users to visualize results and create their own reporting, custom analysis, and correlations.
Value:


Once you've launched QDMWEB QualityScan, see all of your data and batches by your chosen criteria; date, shift, product families, key characteristics, and more

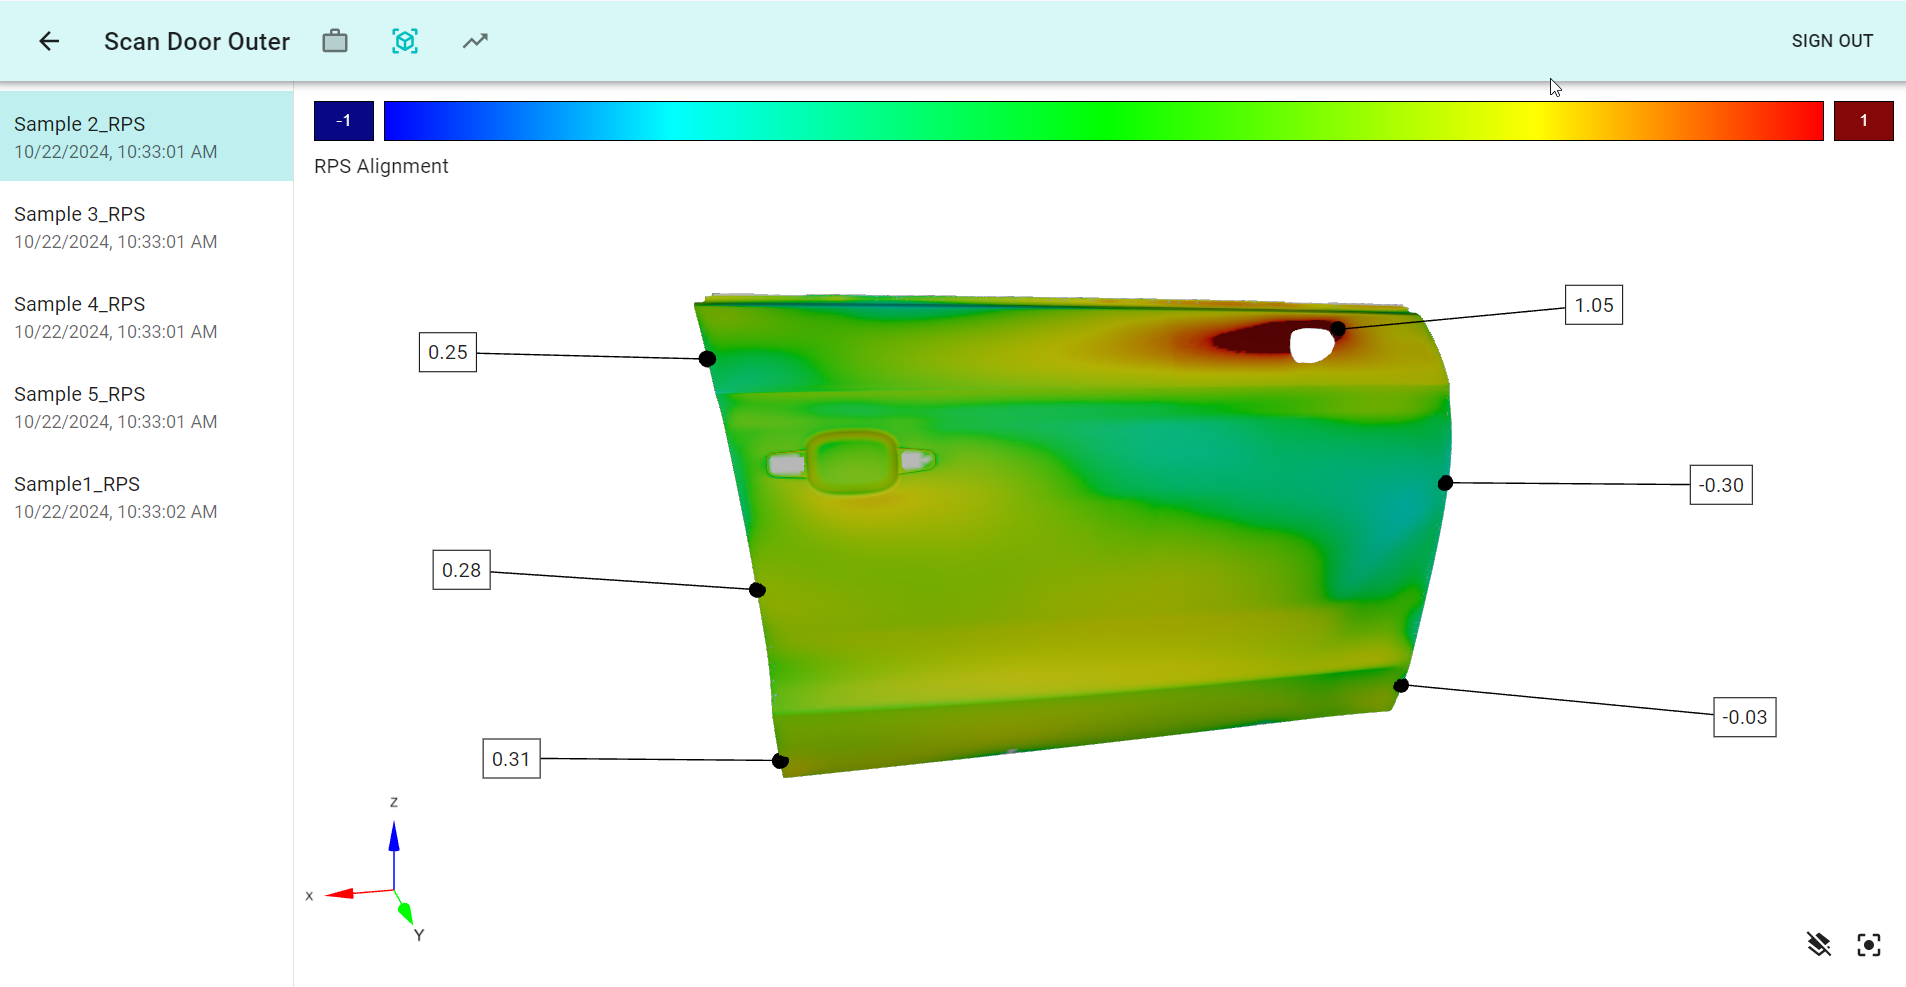
Click through each data set to view key statistical metrics and see the scanned points on your CAD model

A picture is worth a thousand words, and no more than in quality. Use color mapping to quickly see trouble areas on your parts, and convey to stakeholders the issue for fast recognition and problem solving

Incorporate tooling and fixtures into your study and reports to showcase how they affect the scanned area, the overall build, and the resulting quality

Create roles for fast assignment of permissions or add specific permissions for each user to control access to data and analysis. Make is easy for each user to find the data they need, and only the data they need, when they log into the system.

Utilize CAD context in order to clearly communicate with stakeholders, managers, colleagues, customers, and suppliers exactly what your quality is, and where.
Use CAD with your scanned data for powerful reports that allow for fast comprehension and easy sharing with key stakeholders
Leader lines show where each point is measured with values and color codes to easily see which values are out of specification.
Gain complete control over what you are showing and how. Utilize this to show exactly what you want to show without any extra while providing a clear understanding of the scanned data results.
Take complete control of your data to understand exactly what is happening and communicate effectively with stakeholders to make important quality decisions.
Get an immediate overview of your scanned data, then drill down into specific data sets, organizing it by date, batch, job, product family, part number, or other criteria to help you find what you need when you need it.
See all of the measurements directly associated with their CAD feature for immediate recognition of quality results. Show stakeholders precisely where the issues are with color maps and dashboards.
Create custom reports to communicate efficiently with colleagues to promote fast problem recognition and resolution.
Have one of our experts walk you through how QDM ScanWEB can help your team tackle your scanned data and improve your quality efficiency

North American Innovation Center
28064 Center Oaks Ct A, Wixom, MI 48393
Call us: +1 (248) 504 6200