The World's Most Used Variation Analysis Software
3DCS Variation Analyst for NX Software is used by manufacturers across the globe for Tolerance Analysis to reduce scrap, rework and warranty claims.
3DCS Variation Analyst is used by the world's leading manufacturing OEM's to reduce their costs of quality. By controlling variation and optimizing designs to account for inherent process and part variation, engineers reduce non-conformance, scrap, rework and warranty costs.
The Leading Variation Analysis Solution - What is it?
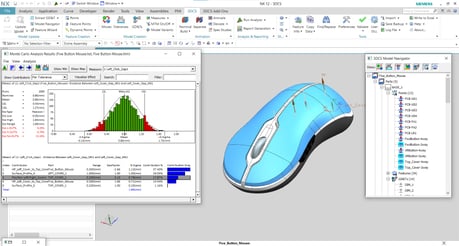 3DCS Variation Analyst for NX is an integrated software solution in Siemens NX that simulates product assembly and part tolerance 3D stack-ups through Monte Carlo Analysis and High-Low-Mean (Sensitvity) Analysis.
3DCS for NX simulates part and process variation with Monte Carlo Simulation to give statistical outputs showing the estimated percent of products that will be out-of-spec, the primary contributing tolerances and parts to variation issues and specified statistical measures such cpk and ppk.
Model Part and Process Variation - How does it work?
 3DCS for NX uses three methods of simulation; Monte Carlo Simulation, High-Low-Mean (Sensitivity analysis) and GeoFactor Analysis. These together highlight the sources of variation as well as potential build issues in the product.
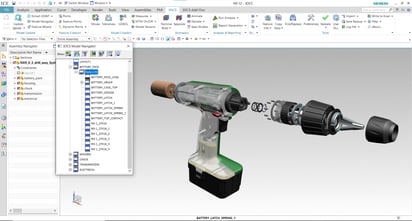
By accurately modeling the build process, users can determine how their process will affect the assembly in addition to their part tolerance stack-up. This together essentially creates a virtual prototype that can be used to make decisions about design changes and tooling while reducing scrap and rework.
What is in a 3DCS model? Click to Learn More
Gain New Insight Into Your Design
 Simulating products in a digital environment gives engineers the ability to account for variation in key areas, reducing rework, non-conformance and scrap at final assembly early in the design phase when changes are least expensive.
In addition to this, specifications deemed less critical can be relaxed, increasing tolerances and allowing the user of less expensive manufacturing processes. Creating 3-dimensional tolerance stack-ups let engineers know where to focus in their design, and the ability to create what-if studies allow them to determine solutions that include both process and tolerances to keep costs down and quality up.
As CAD technology continues to advance to include greater levels of analysis, our open API strategy allows us to support the incorporation of tools like 3DCS software to keep up with the growing demands of customers. The partnership between Siemens and DCS will allow an integrated environment, giving NX users access to advanced analysis as part of the CAD environment.
Bob Haubrock, Vice President, Product Engineering Software, Siemens PLM Software


